The Modern QSR Bottleneck Crisis
The drive-thru should be operating at peak efficiency, yet the queue stretches well beyond its intended capacity. Headlights stack up as vehicles advance in short, hesitant intervals. The order window becomes a choke point. Inside the store, staff rotate between stations under mounting pressure, reacting to demand rather than controlling it. Despite sustained effort, service velocity declines and with it, the customer experience.
Inside vehicles, customers feel the pressure too. Every extra minute increases impatience. One car pulls out of the lane. Then another. And another.
Studies show that nearly 70% of QSR customers abandon a drive-thru line if the wait feels too long, and every minute of delay can cost stores significant daily revenue. Long queues don’t just slow down service, they directly hit NPS scores, repeat business, and store profitability.
So what’s really going wrong? It’s the lack of real-time visibility, no live understanding of queue length, vehicle flow, bottleneck windows, staff productivity, or footfall patterns.
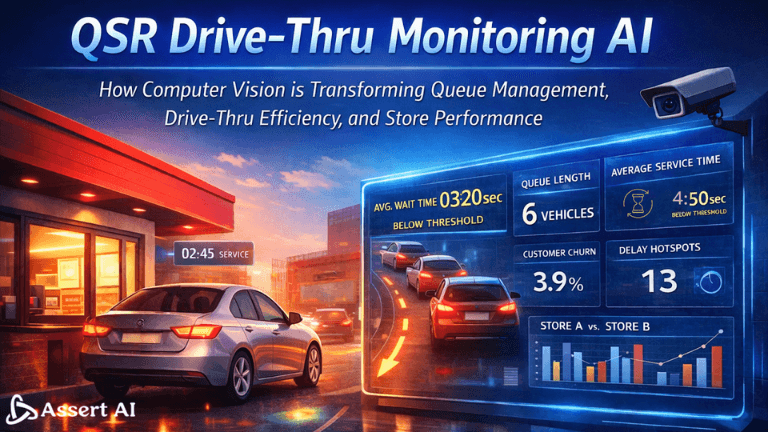
This is where Drive-Thru Monitoring AI is transforming the game.
What Is Drive-Thru Monitoring AI?
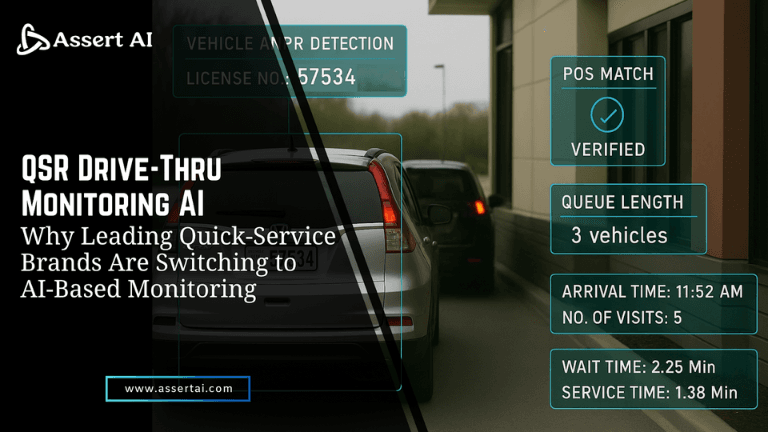
Drive-Thru Monitoring AI is the layer of real-time intelligence your cameras were secretly waiting for. Instead of acting like passive observers, your existing CCTV network becomes a high-speed decision engine that understands the entire drive-thru journey as it unfolds.
Think of it as an operations co-pilot, one that never blinks. Just like modern traffic systems adapt to rush-hour flow, Drive-Thru AI watches vehicles, staff movement, queue buildup, lane behaviour, and service stages in real time. It recognises patterns, spots inefficiencies, and highlights exactly where your service flow is slowing down.
This isn’t “plug a smart camera and pray it works everywhere.” This is tailored AI, trained for your layout, your rush hours, your quirks, your bottlenecks.
Your infrastructure stays the same.
Your intelligence level does not.
Core Components
Computer Vision Engine
Understands vehicles, staff, queue dynamics, and service flow with frame-level accuracy.
Live Event Intelligence
Instantly detects delays, stagnation, order-pileups, and slow handoffs the moment they happen.
Vehicle Journey Tracking
Follows every car from entry → order → payment → pickup → exit with precise timestamps.
Service Workflow Monitoring
Identifies idle windows, slow transitions, and pressure zones so teams can respond before queues spill over.
ANPR + POS Mapping
Connects vehicle identity with billing, enabling insights on unbilled orders, repeat customers, average order value, and lane-level revenue.
The Big Shift
CCTV shows you what happened.
Vision AI shows you what’s happening and how to fix it right now.
And very soon, every high-performing QSR will rely on this kind of real-time view. Not because it’s a trend, but because once you see operations this clearly, there’s no going back.
The 5 Invisible Losses Every QSR Faces (And AI Uncovers Instantly)
Loss #1: Queue Overflow and Customer Abandonment
Long queues don’t just look bad, they actively push customers away. When vehicles at the drive-thru queues stop moving or wait times feel uncertain, customers leave before ordering. Without AI, these losses remain invisible because abandoned queues are rarely tracked.
Loss #2: Drive-Thru Congestion and Processing Delays
Bottlenecks often form at specific windows order, payment, or pickup but without clear data, they go unnoticed. Small delays compound across dozens of vehicles, reducing overall throughput during peak hours.
Loss #3: Idle or Underutilised Staff Time
Even during rush periods, staff resources are not always optimally deployed. Some stations may be overloaded while others remain idle. AI reveals these imbalances by mapping activity patterns in real time.
Loss #4: Footfall and Staffing Mismatch
POS data alone doesn’t reflect actual demand. Vehicle count, queue length, and service load often diverge from order data. This mismatch leads to reactive staffing instead of proactive planning.
Loss #5: Store-to-Store Performance Variability
Without standardised performance visibility, high-performing stores cannot be replicated, and struggling locations remain unsupported. AI brings consistency by benchmarking every store against the same KPIs.
Each of these losses directly affects customer satisfaction, speed-of-service, and long-term loyalty.
How AI Monitors Queues & Wait Times in Real Time
Drive-thru monitoring AI works by continuously analysing live camera feeds to understand how vehicles move, wait, and progress through each service stage. Using computer vision, the system identifies queue formation, tracks vehicle dwell time at every touchpoint, and predicts wait times based on real-time and historical patterns. Instead of relying on manual checks or delayed reports, managers gain instant visibility into where congestion is building and how it will impact throughput. This allows teams to intervene early before delays translate into customer frustration or queue abandonment.

Micro Use Cases:
- Responding to Live Queue Alerts
When queue length or wait time crosses set thresholds, AI triggers instant alerts for store managers. This enables quick corrective actions such as reallocating staff or opening additional service capacity before congestion escalates into customer drop-offs or service breakdowns.
- Reducing Customer Anxiety Through Wait-Time Forecasting
By continuously predicting wait times based on live conditions, AI helps maintain smoother, more predictable drive-thru flow. Proactive visibility reduces uncertainty for staff and customers alike, improving perceived service speed and overall experience.
Drive-Thru Performance & Vehicle Analytics: The New Goldmine
Drive-thru performance is often judged by a single number average speed of service. But in reality, performance is the sum of multiple micro-interactions happening across windows, lanes, and handoffs. Vision-based vehicle analytics breaks this complexity into measurable, actionable insights that managers can actually use.
Key Performance Metrics Captured by Vision AI
Computer vision continuously tracks order window time, revealing how long vehicles spend placing orders and where menus or ordering processes slow flow. It measures stagnation time, identifying moments when vehicles stop moving despite open capacity ahead, often a sign of internal handoff delays.
Through vehicle detection and ANPR, each car is uniquely tracked across the entire journey, ensuring accurate timing even in dense or multi-lane drive-thru environments. This enables precise calculation of speed of service from entry to exit, along with throughput per hour, showing how many vehicles are actually served during peak demand.
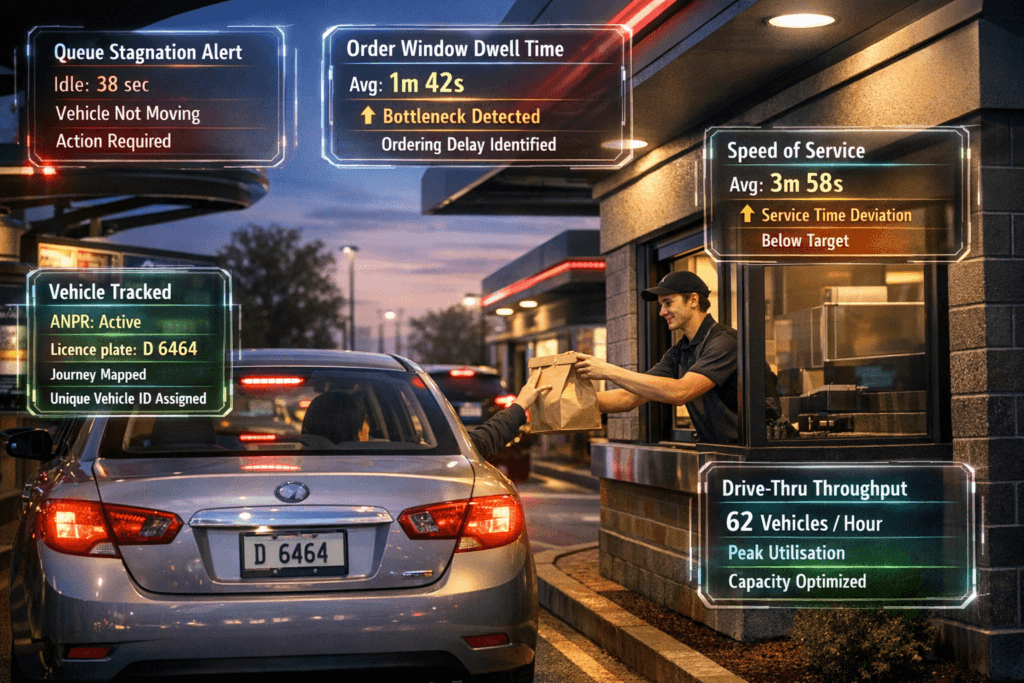
Together, these metrics form a live performance table; one that updates continuously and reflects real conditions rather than estimates.
Manual Tracking vs AI-Led Tracking: A Clear Contrast
Traditional drive-thru measurement relied on manual timing, periodic observation, or POS-based assumptions. These methods are inconsistent, delayed, and often miss hidden delays between service stages. In contrast, AI-led tracking captures every vehicle, every second, and every service interaction automatically.
Where manual tracking provides averages, AI reveals patterns. Where manual methods react after the shift ends, AI enables intervention during the rush itself. This shift from retrospective reporting to real-time insight fundamentally changes how drive-thru performance is managed.
Real-Life Operational Scenarios Enabled by AI
In one common scenario, AI highlights that while overall service time appears acceptable, one specific window consistently causes delays. Managers can pinpoint this bottleneck instantly and correct it before queues escalate.
In another case, stagnation data reveals slow staff handoffs during peak periods, something that may not be obvious on the floor but has a measurable impact on throughput. Adjusting task allocation or handoff sequencing immediately improves flow.
For multi-lane drive-thrus, AI compares lane performance in real time, identifying imbalance or underutilisation. Managers can then redistribute staff or guide vehicles more effectively to maintain even flow.
Operational Impact: Speed Translates Directly to Revenue
Every second saved at the drive-thru compounds across hundreds of vehicles per day. Faster speed of service increases vehicles served per hour, which directly raises daily ticket counts without adding lanes, staff, or infrastructure.
By transforming raw vehicle movement into actionable performance intelligence, vision AI turns drive-thru efficiency into a predictable, scalable growth lever.
Staff Productivity & Shift Efficiency: How AI Reveals Real-Time Performance Gaps
Drive-thru efficiency depends not just on staffing levels, but on how staff movement and effort align with real-time demand. Behaviour analytics powered by computer vision brings clarity to this relationship by turning everyday activity into measurable operational insight.
- Idle vs Productive Time Visibility
AI differentiates between active service time and idle gaps, helping managers understand whether delays are caused by labour shortages, workflow sequencing issues, or upstream bottlenecks without subjective judgment.
- Peak-Hour Staffing Mismatch Detection
By correlating staff activity with queue pressure and vehicle flow, AI reveals moments when teams are under-resourced or misallocated during rush periods, enabling faster and more precise interventions.
- Underperforming Window Identification
Certain drive-thru windows consistently slow overall throughput. Behaviour analytics surfaces these patterns clearly, allowing targeted corrections without disrupting the full operation.
- Exposing Silent Bottlenecks
Manual handoffs and repeated back-and-forth movements often create delays that go unnoticed. AI makes these silent bottlenecks visible by mapping dwell time and movement inefficiencies.
- Heatmaps for Workflow Optimisation
Staff movement heatmaps highlight congestion zones and unnecessary travel, enabling layout improvements and smarter task allocation that boost efficiency without increasing headcount.
- Data-Driven Shift Planning
With real-time performance visibility, managers can plan shifts based on actual demand patterns rather than assumptions improving service consistency and staff experience.
Most importantly, AI doesn’t punish staff, it guides better staffing decisions.
By focusing on system behaviour instead of individual blame, computer vision helps QSRs support teams while improving drive-thru performance.
Footfall Intelligence & Store Benchmarking with Computer Vision
Footfall intelligence helps franchise owners and operators clearly see how customer demand builds, shifts, and moves across the store throughout the day. Instead of relying on assumptions, computer vision breaks this activity into simple, visual layers that are easy to understand and act on.
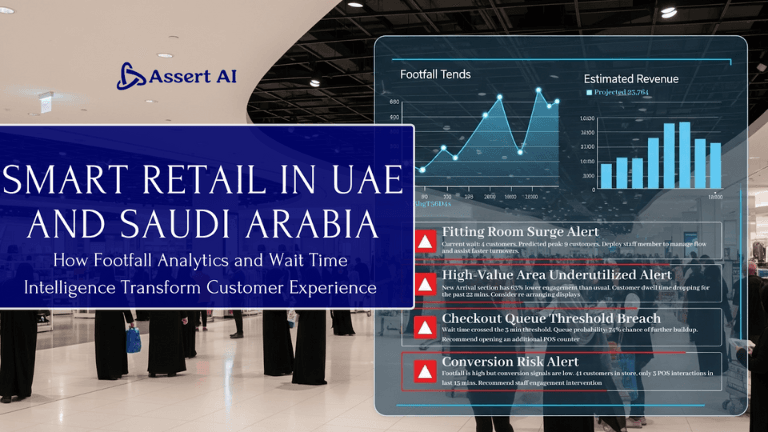
Multi-Layer Footfall Insights at a Glance
Footfall patterns across the day
AI shows when customer volume rises or drops, helping owners prepare for lunch rushes, evening peaks, and sudden surges.
Dine-in vs pickup vs drive-thru behaviour
Traffic is clearly separated by service type, making it easier to identify where demand is building and which channels need support.
Peak-hour crowd shifts
During busy periods, AI highlights how customers move between zones, revealing spillovers that create queues and delays.
Staffing demand prediction
By linking footfall with service speed, the system predicts staffing needs in advance before service quality is impacted.
All of this is typically visible on a single footfall and performance dashboard, giving owners instant clarity without complex reports.
Store-to-Store Benchmarking That Actually Helps
Once footfall data is captured consistently across locations, benchmarking becomes meaningful rather than theoretical. Franchise owners and corporate teams can compare stores using real operational KPIs such as speed of service, queue formation patterns, customer churn signals, and recurring delay hotspots.
Instead of asking “Why is this store slower?”, the dashboard shows exactly where and when performance deviates. High-performing locations become reference models, while struggling stores receive targeted, actionable guidance rather than generic feedback.
How Corporate Teams Turn Benchmarks into Franchise Strategy
For corporate teams, benchmarking shifts from ranking stores to enabling performance. Data highlights which operational approaches work best under specific demand conditions and helps replicate them across the network.
This supports smarter staffing guidelines, targeted operational support, and more consistent customer experiences while giving franchisees clear, data-backed direction rather than generic instructions.
Implementation Blueprint: How QSRs Deploy Drive-Thru Monitoring AI
Phase 1: CCTV Audit and Coverage Assessment
Existing camera infrastructure is evaluated to ensure optimal visibility across lanes and windows.
Phase 2: Zone Configuration
Drive-thru paths, queue areas, and service windows are digitally mapped for accurate detection.
Phase 3: Model Training and Calibration
AI models are fine-tuned to the store’s unique layout, traffic patterns, and operational flow.
Phase 4: POS and Dashboard Integration
Vehicle analytics are connected with order data and management dashboards for unified insights.
Phase 5: Pilot and Scaled Rollout
Brands typically pilot in select locations before expanding across regions, ensuring fast ROI with minimal risk.
Why Choose Assert AI for Drive-Thru Monitoring?
Drive-thru performance is too critical to be left to generic analytics tools. Assert AI is purpose-built for QSR environments, helping brands move from reactive problem-solving to proactive operational control especially during peak hours when every second impacts revenue.
Computer Vision Trained for Real QSR Conditions
Assert AI’s models are trained on live QSR scenarios, including multi-lane drive-thrus, high vehicle density, and peak-hour congestion. This ensures accurate, consistent insights when traditional tools fall short.
Multi-Store Dashboards with Meaningful Benchmarking
Our dashboards go beyond reporting to show how stores, shifts, and regions truly compare. Leadership teams can identify best practices, pinpoint underperformance, and drive consistent execution across locations.
Real-Time Alerts That Prevent Revenue Loss
Instant alerts for queue build-ups, service delays, and staffing gaps allow managers to act before issues escalate protecting throughput and customer experience at the moment.
Fast Deployment with Existing CCTV and POS
Assert AI integrates seamlessly with current cameras and POS systems, delivering value quickly without operational disruption or heavy infrastructure changes.
Flexible Workflows for Every Restaurant Format
Whether single-lane, multi-lane, or hybrid formats, Assert AI adapts to each restaurant’s workflow ensuring insights remain relevant and actionable.
The outcome is simple: faster speed-of-service, higher daily order volumes, and stronger revenue retention without adding staff or infrastructure.
Why Drive-Thru AI is No Longer Optional
The future of QSR operations will not be decided by who adds more staff or builds bigger lanes. It will be decided by who sees faster, decides sooner, and acts in real time.
Today’s customers don’t measure effort, they measure experience. Every extra second in the queue, every stalled handoff, every unexplained delay quietly erodes trust and revenue. And in a world where competition is always just one exit away, guesswork is no longer good enough.
Drive-thru monitoring AI transforms the drive-thru from a black box into a live command centre. It gives operators clarity in peak moments, control during chaos, and confidence in every decision. For QSR brands focused on speed, consistency, and scale, AI is an operational infrastructure.

👉 Book a demo with Assert AI today and see how leading QSR brands are cutting queues, accelerating service, and capturing revenue that used to drive away.